B-Spline Curve Generator
An interactive Python application for generating and visualizing 2D and 3D B-Spline curves using De Boor's algorithm and least-squares approximation.
Outcomes
- Implementation of De Boor's algorithm for curve generation.
- Least-squares approximation for curve fitting.
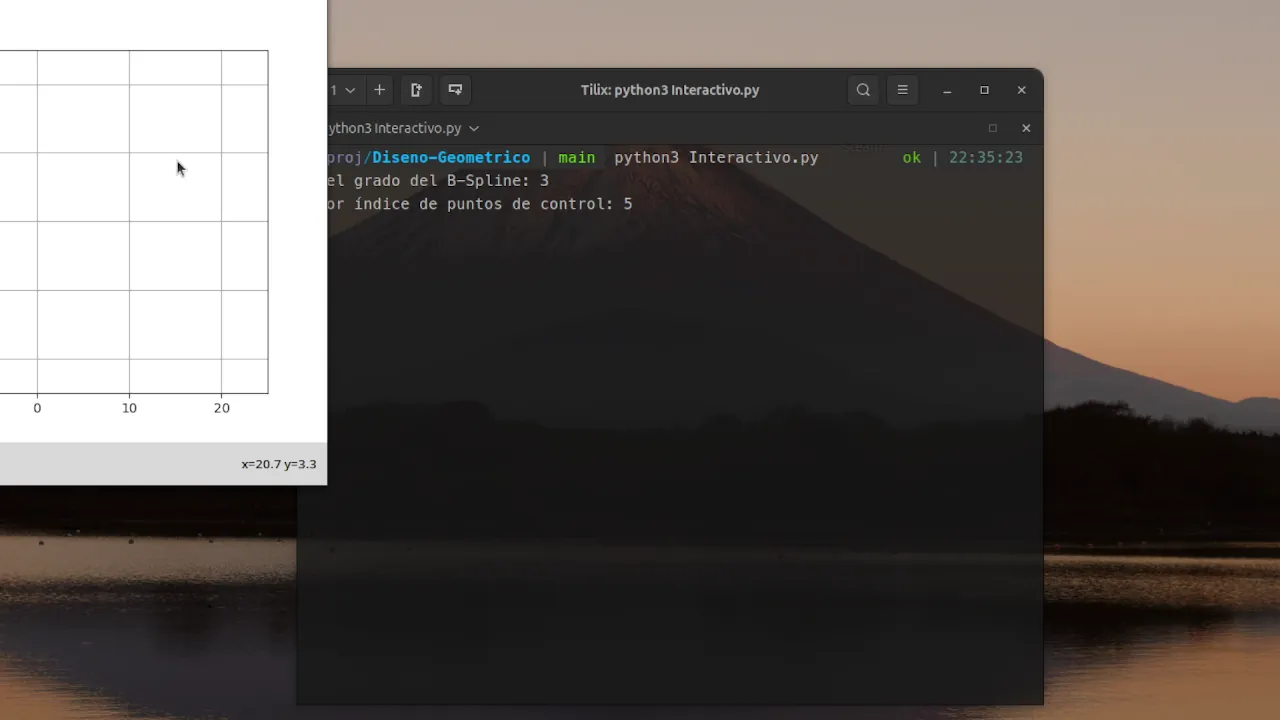
- Interactive mode for real-time curve manipulation.
Team & Process
This project was a collaborative effort by a team of five students. The team included mathematics students who focused on the theoretical foundations and proofs, while others focused on the software implementation. Our approach was heavily research-driven, involving the study of academic papers such as "Least-squares B-spline curve approximation with arbitrary end derivatives" to correctly implement the underlying algorithms.
Overview
This was a final project for a Scientific Programming course, focused on the implementation and visualization of B-Spline curves, a fundamental concept in geometric design and computer graphics. The project explores different methods for generating and manipulating these complex curves.
Core Features
The project is built in Python using NumPy for numerical operations and Matplotlib for 2D and 3D plotting. It's structured around three main functionalities:
-
Direct Generation (De Boor's Algorithm): The application can take a set of control points and a knot vector from text files and render the corresponding B-Spline curve. This demonstrates the foundational algorithm for evaluating points on a curve.
-
Least-Squares Approximation: Given a set of data points (observations), this feature calculates the optimal control points to generate a B-Spline curve that best approximates the data. This is essential for curve fitting applications.
-
Interactive Mode: This is the project's most dynamic feature. It opens an interactive Matplotlib window where the user can click to add points, right-click to remove them, and drag them around. The B-Spline curve is recalculated and redrawn in real-time, providing immediate visual feedback on how control points influence the curve's shape.